Scheduled Website Maintenance
We’re currently in the process of moving to a new and improved server environment. During this transition, the website may experience brief interruptions or temporary outages.
We appreciate your patience while we complete this upgrade. Service will return to normal shortly, with improved performance and reliability.
Thank you for your understanding.
Technology is a wonderful thing. At the stroke of a few keys, artificial intelligences can produce songs about rugby, broken lawn mowers, or anything else you like. This AI is limited to 2 minute songs, but that’s not a problem for anyone with good taste in music. Pretty soon, they’ll be generating rugby matches for us on demand, not just commentary, but with visuals, and with the results we want Do you want to see the Waratahs beat the All Blacks, or maybe a team of 30 local under 14s beat Ireland?
But in the mean time, we’ve got plain old fashioned number crunching that can at least tell us something about how teams that don’t play each other compare.
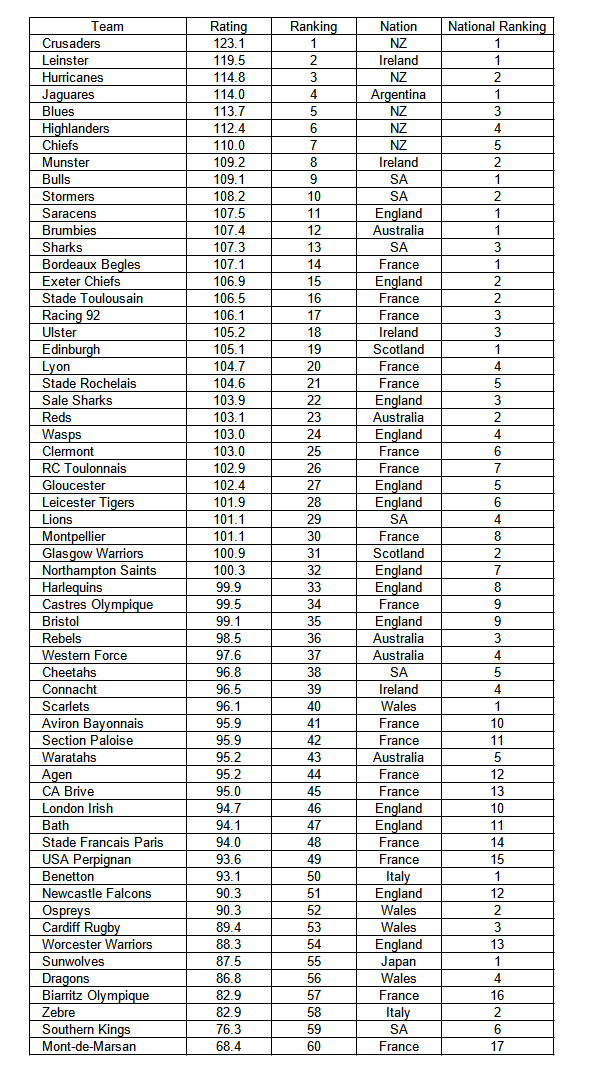
After the COVID disruptions to rugby, the South African teams moved from Super Rugby and joined with the Pro 14 to form the United Rugby Championship. This resulted in a connection between all European teams and all Super Rugby teams. Not all teams have played each other, but all teams have played against a number of common opponents, and this makes it possible to compare in a statistical way all of the teams using a modern ratings system. And the following is a table ranking all European and Super Rugby teams together.

First things first, and that’s the Crusaders at the top. The table doesn’t use this years results. It is based on the following competition seasons:
- Super Rugby 2019
- Super Rugby 2021 – AU, Aotearoa, and Trans Tasman
- European Rugby Championship 2019-2020
- European Rugby Championship 2021-2022
- Pro 14 2019-2020
- United Rugby Championship 2021-2022
- Top 14 2019-2020
- Top 14 2021-2022
- English Premiership 2019-2020
- English Premiership 2021-2022
The worst affected COVID period is not included, only the year before and the first mostly undisturbed season after for each competition.
I could have done this calculation about 20 months ago, but better late than never.
The ratings system is one I’ve used in previous articles on ranking teams . The rating numbers are a least squares fit to the winning margins of all of the matches, with 100 added so that no team ends up with a negative rating. If you subtracted 100 from the rating number, you’d get what is expected to be the team’s average wining margin after a full home and away season against all 59 other teams.
The difference between two teams’ ratings is the expected margin if they played at a neutral venue. So, for example, the Crusaders would be expected to beat Leinster by 3.6 points. On any one day, a team might be up or down by 10 or so points, and home advantage is 3 points. So according to these numbers, the Crusaders would beat Leinster more than the other way around, but perhaps only 60% of the time, because their ratings are quite close. The Crusaders against Mont-de-Marsan on the other hand is a 54.7 points difference, and the Crusaders would be something like 99% sure to win.
The top ten has 5 NZ teams, and 4 from the URC (2 Irish and 2 from SA). Adding the South African teams has made the URC much more competitive without diluting the highest level of its play. I guess that’s obvious to anyone watching the URC or at least looking at the URC results.
There’s a difference of ten ratings points between 1st and 5th in the table, but you have to go another 17 places to see a further drop of 10 ratings points, and 23 more places to see another drop of 10 points. The middle of the table is full of teams close in standard. A league of these teams (and it would take 4 years to complete a home and away schedule with 60 teams) would have plenty of close matches.
I’m not sure what else to say. A play off match between The Super Rugby Pacific champion and the European Rugby champion would probably be a competitive match most years. It might be worth putting in place.

