Well let me say from the outset that Saturday’s result was not really a massacre. I will present a few bit of analysis that hopefully back up my point. Oh and thanks for the guy’s at Green and Gold for not telling me that in Oz the term ‘rock-spider’ refers to a peadophile. I spent most of last week batting that wicket on social media.
The good news
For the third week in a row, the Wallaby’s fundamentals were sound. We slipped a line-out on our own feed near the death, and we lost ‘that’ scrum to a penalty, which is something every player in the tight 5 will henceforth remember and learn from, but overall we managed to secure our ball.
We also created a lot of opportunities, but it’s starting to sound a bit lame (or like coach-speak) to keep harping on about how many opportunities we create, when for the 3rd week in a row we butcher so much of it.
Our weakness exploited
Often when an opponent plays in a certain way, it’s not because they are so good at it. They might just play that way because they know they can control how the opposition will respond to it. I generated this table to study the first half, and immediately noticed New Zealand pulling a cheeky:
Look at the % ball surrendered for territory stat, and you will notice how New Zealand in the first half to give back almost half of all their possession, because they know we will not kick it back. The Wallabies at the moment prefer to keep the ball in hand, even in their own 50, area.
But whereas last week managed to exit properly and make progress up-field, partly because Smith and Ioane were not chasing kicks properly, this week we gained less field (momentum stat). All they had to do is kick is and chase it properly, because the Wallabies right now has no variation to this strategy.
And then errors came..
It’s one thing not being able to exit properly. But being plain shaky with ball in hand is a recipe for a 36-points loss. Check out the same stats for the second half to see what I mean:
Now New Zealand kicks a bit less and we stop kicking altogether, as they would have predicted (% ball surrendered stat again). With tired bodies both defensive lines start to crack, but the proverbial plumbers crack is our error rate.
This stat looks at the amount of handling errors we make on attack and tackles we miss on defence. We mucked up almost 60% of everything we did at this stage, which is a worse stat than my wife registers trying to barbeque ribs.
Intent
Remember how New Zealand played against Ireland the week after the Chicago loss? Cast your eye to this stat to see from the first half how the Kiwi’s react to a loss:
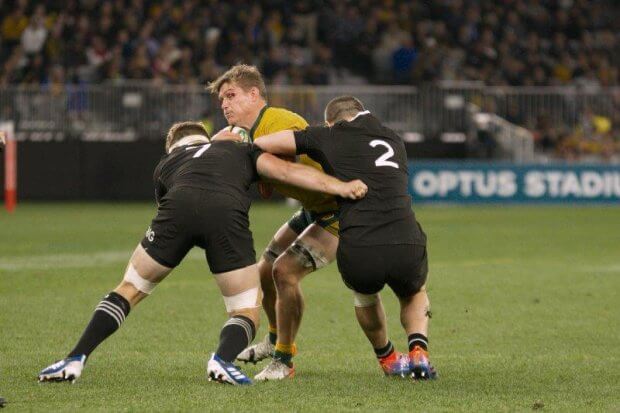
15.56 of all their tackles were dominant. 4.42 of ours were. Guess who wanted this more?
Want to help generate awesome stats for the World Cup with me? Email bren@rugbycology.com and get involved!


