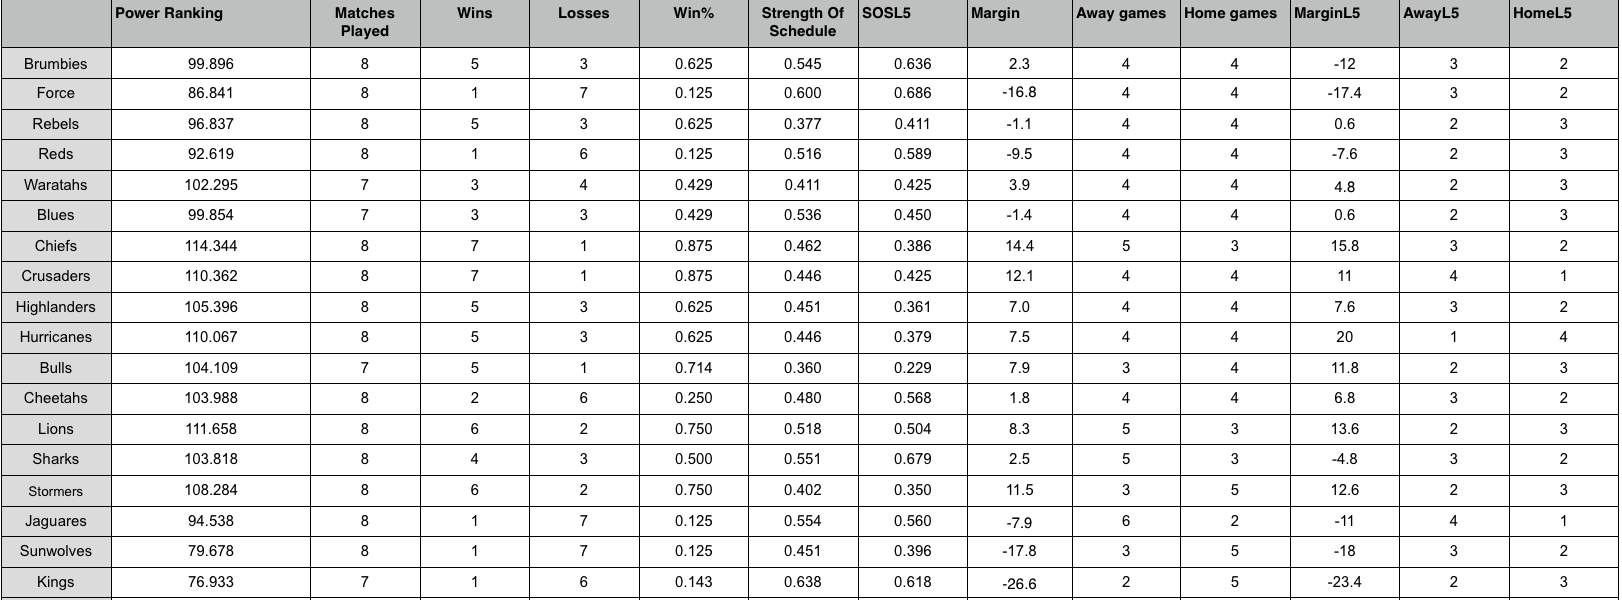

Super Rugby Power Rankings
With two New Zealand teams dominating water-cooler discussions of Super Rugby’s strongest teams, Green and Gold Rugby have wheeled out our calculators to find out just how the team’s rank with our first Power Rankings of the year.
Piggybacking off the work of NBA analyst John Hollinger, we’ve crunched the numbers to provide a different perspective for those sick of pundit’s gut feelings and general impressions.
Hollinger’s formula for calculating Power Rankings, detailed below, is best explained by the man himself.
“One of my goals was to create a system that told us more about a team’s quality than the standings do,” Hollinger said. “So instead of the number of games won, these rankings use points scored and points allowed, which are better indicators of a team’s quality than wins and losses.”
“This might not sound right at first, but studies have shown scoring margin to be a better predictor of future success than a team’s win-loss record. Thus, scoring margin is a more accurate sign of a team’s quality,” Hollinger said.
Hollinger’s formula is weighted to celebrate teams with high-scoring attacks and deadlock defences, with an additional reward for competing at high levels away from home.
The key to Power Rankings glory is to dominate Points for and against, away from home, against the strongest teams in the competition.
Hollinger’s POWER RANKING FORMULA = (((Strength Of Schedule-0.5)/0.037)*0.67) + (((SOSLx-0.5)/0.037)*0.33) + 100 + (0.67*(MARG+(((ROAD-HOME)*3.5)/(GAMES))) + (0.33*(MARGLx+(((ROADx-HOMEx)*3.5)/(10))))
The Bottom Feeders
18. Southern King’s – 75.933
The Kings have been nothing short of a disgrace to Super Rugby and stand as a testament to South African bully-boy tactics at SANZAR’s negotiating table. Through seven matches, the Port Elizabeth pretenders have gone down by 26 points per game en route to securing the worst Power Ranking I’ve seen since I began calculating the statistic in 2013 – by 10 whole points.
17. Sunwolves, 79.678
With a stunning absence of marquee signings that could help ease the Sunwolves’ difficult transition to Super Rugby, combined with the refusal of most South African teams to travel to Tokyo even once per year, has left the Japanese side with just five authentic home games in 2016 – the third of which has produced their only win. An ugly 92-17 loss to the Cheetahs mars the Sunwolves Power Ranking.
16. Western Force, 86.841
The Force have dealt with the most difficult season in Super Rugby bar the Kings, who hold the significant disadvantage of not playing themselves in the regular season. The Force have been run down by New Zealand’s top four teams in the last five weeks before capitulating against the Wallaby-heavy Waratahs, 49-13.
15. Queensland Reds, 92.619
The Reds’ series of narrow matches and win over the Highlanders would have earned the Queenslanders a nice boost up the Power Rankings ladder, if not for consecutive 20-point defeats to the Bulls and Stormers in South Africa. Through rose-coloured glasses, watch the Reds climb the rankings in weeks to come.
14. Jaguares, 94.538
Though the Jaguares have yet to live up to expectations in Super Rugby, an exciting backline and talented forward pack have the potential to carry the side forward in years to come. The Jaguares have also been victims of the their new group-mates hatred of travel, playing just two games in Argentina from eight thus far, going down by 7.9 points per match on average.
13. Melbourne Rebels, 94.538
Australia’s top Super Rugby side have been hamstrung by a negative points differential despite playing one of the tournament’s easiest schedules, with an opposition winning percentage of just 38% in recent weeks. The Rebels’ next move will be to string wins together to consolidate their position atop the Australian Group in preparation for what will be a dogfight to enter the finals.
The Mid-Table Warriors
12. Auckland Blues, 99.854
The Blues have scratched their way to a points differential of 0.6 from their last five matches, establishing themselves as the clear fifth team in the incredible New Zealand Group.
11. ACT Brumbies, 99.896
The Brumbies lost their grip on top spot in the Australian conference last week and have accordingly fallen down the Power Rankings. Plummeted, actually. Big home losses to the Chiefs and Crusaders were compounded by a convincing loss to the Stormers at Newlands, carrying the Brumbies to a points differential per game of -12 since Round Five.
10. NSW Waratahs, 102.295
Similarly to the Bulls, the Waratah’s presence over 100 points is confusing. A big win over the lowly Western Force dragged their Points Differential statistic up to 3.9 per game, against a relatively easy schedule (43%).
9. Sharks, 103.818
The Sharks escaped a nightmare stretch of games only slightly in the red (-4.8 PPG), facing Super Rugby’s second-most difficult schedule (68% win rate) with fixtures against the finals-bound Crusaders, Lions, Highlanders and Bulls since Round Five.
8. Cheetahs, 103.988
Thanks to their 92-17 point thrashing of the Sunwolves, the Cheetah’s escaped a tough five week period (56% opposition win rate) with a positive points differential (6.8), hoisting them up over teams that couldn’t score big enough against the minnows when it counted.
7. Bulls, 104.109
Amazingly, the Bulls come in next despite playing the competition’s easiest schedule over the last five weeks (22% opposition win rate: Sharks, Kings, Sunwolves, Reds and Cheetahs) and have only won by 11 on average. Puzzling.
The Cream of the Crop
6. Highlanders, 105.109
The Highlanders have played opponents with a combined win rate of 36% in the last five weeks, but have only won by seven points on average. The stats are harsh on the Highlanders, but the lack of double digit victories has kept them out of the Top Five.
5. Stormers, 108.284
Rounding out the most in-form teams are the Stormers. They’ve been trashing teams by 12.6 points per game over the last five matches to secure their place in Super Rugby’s top five form teams.
4. Hurricanes, 110.067
The ‘Canes have played four at home in the last five, but made them count by belting teams by an incredible 20-points on average. The Hurricanes’ statistics put them on level with the Crusaders in Round 10 – the real test will come when they play more games away from home.
3. Crusaders, 110.067
The Crusaders have played four games away from home in the last five, but that hasn’t put a dent in the Cantabrians charge for top spot in New Zealand. The Crusaders have put the opposition to the sword by 12.6 points per game so far in 2016.
2. Lions, 111.658
Tying the Chiefs for most away games, with five, the Lions have similarly hit their straps in April. With a 13.8 scoring margin over the past five weeks, the Lions have announced themselves as the team to beat in South Africa.
1. Chiefs, 114.344
While there’s no place like home, the ability to win away from your adoring fans is the calling card of a great team. The Chiefs lead Super Rugby in away matches and have been trouncing their opposition by 15.8 points per game over the last five weeks. The Chiefs have hit incredible form in April – which might just be the understatement of the year.
The Maths