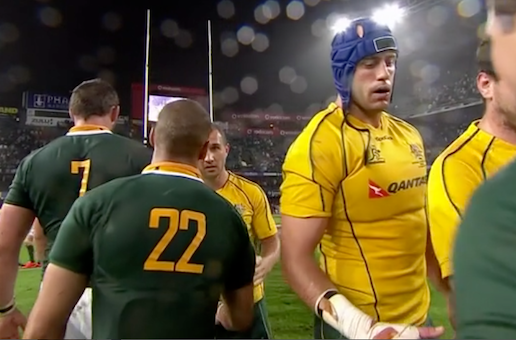
We like to paint a picture of the Boks as lumbering brutes up front and kick-bots out the back. Give them a coach who’s run the Blue Bulls since the turn of the century and the stereotype is complete.
In the media lead-up to this weekend’s Test the actors have played their parts as well — it’s all been about how the Boks will do their best to contain our backline while the Wallabies have been talking about making it rain tries.
But stripping away the preconceptions, what do the stats for these two teams in 2012 tell us about how they’re really playing in comparison to the men in gold?
Jumping to the pointy end, the apple cart is upset already. The ‘boring’ Boks are scoring more than two tries a game; the Wallabies only one. To be fair, though, we have been playing the best in Europe and the best in the world, they’ve played two countries who would squabble over a few rocks lying off Antarctica. This means the meat-eaters end up averaging 23 points for and 16 against, whereas the Wallabies have been scoring 16 and letting in 20.
So what’s beneath this scoring? What kind of game shape are we seeing? Surely it’s the story of the Jarpies hoofing anything that comes their way and chasing as if their braai was out of control?
 A good indicator is always the number of ruck/mauls made by the teams and in this they are spookily close, the Boks averaging 104 a game and the Wallabies 105. The continuity numbers aren’t that far off either. The Boks are breaking more tackles (19 versus 16), making more offloads (5.4 versus 4.2) and almost exactly the same number of line-breaks (1.3 versus 1.2).
So if you had to pick the better attacking team by the numbers so far this year, it’s the men in green. But to be honest, the numbers above really say that neither team has cut loose. New Zealand, by contrast, made 21 offloads and 4 line breaks in the Eden Park match alone.
What about defence? The Saffas actually have longer between tackle misses (1:12 versus 1:02) and miss fewer per game (16 versus 17.2). And while we always mock them for choosing baby eaters in the back row rather than fetchers, they’re making more ruck/maul steals per game than our pack full of opensides (2.8 versus 1.8).
But just when you wonder which way is up anymore, I give you the tactical kicking-from-hand numbers. The Wallabies take an average 49 seconds of possession until Berrick’s kick reflex fires; for the Boks it’s only 35 seconds between demonstrations of Morne’s favourite pastime. This adds up to 24 kicks per match for the Wallabies (high) and 32 for South Africa (even bloody higher).
So if you had to guess the way this game will pan out, you’d figure there’ll be plenty of aerial ping-pong. Will the Wallabies out-dazzle our lead-footed friends? Based on these numbers and Scott’s fantastic series during the week, I’m not so sure….
Thanks to RuckingGoodStats for the numbers


