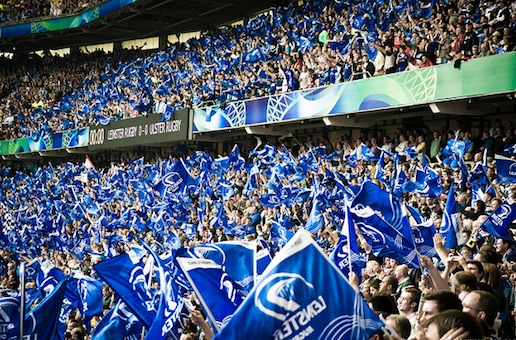
I’ve looked at the attendance trends for the Aussie Super teams and footy codes, we’ve looked at the difference between the Super Rugby conferences. Now let’s have a look at how the Super Rugby crowds measure up against the Heineken Cup.
Actually, they don’t too badly. Even though it boasts the world record crowd for a club rugby game (83,761 for a match between the Harlequins & Saracens on 1 April 2012), the Heineken Cup obviously does not consistently attract the crowds that Super Rugby does in the southern hemisphere. Even Australia, being the middle child of Super Rugby and fairly close to the overall average, can boast that we get more feet through gates and bums on seats for a rugby game than most of the clubs competing in Europe. (OK, that may be a long bow to draw, but as I said last week, there are ‘lies, damned lies and statistics’.)
If we have a quick glance at individual games within Super Rugby, the highest attendance in the regular season was 53,612 for the Bulls versus Stormers in Round 5 of the 2011 comp. If we look at the finals from the last two seasons the highest crowd was the 52,113 who attended the Reds versus Crusaders in 2011.
In the 2012 season the matches with the largest crowd in each of the conferences were all local derbies – Blues versus Crusaders for New Zealand, Reds versus Waratahs in Australia, and Bulls versus Stormers in South Africa.
Interestingly, in 2011 the Crusaders were involved in two of these games, including their match against the Sharks at Twickenham. It will be interesting to see what happens in the 2013 season, but maybe SANZAR actually has the format right for attracting people to the games.
 So from all of these figures I have thrown around over the last 1,200 or so words, what can we say about the state of play of Australian rugby? Or at least the crowd attendances?
Although our average crowd attendances are significantly higher than those in New Zealand, it is a concern that three of our teams are in the bottom four of the Super Rugby competition. The Reds coming in second and the Waratahs at sixth manage to keep our average respectable. The Waratahs are still below the overall Super Rugby average.
All of the conferences have a general downward trend over the last seven seasons, so we are not on our own with falling numbers. We all had significant drops between the 2008 and 2009 seasons. If I were an economics wiz I could make up some theory about the association between the global economic performance and Super Rugby crowd attendances. But I’m not, so I will just say that there was a global event around then that may have affected the disposable income of the average rugby-going person in the three countries.
Despite these falls we are still attracting significantly larger crowds than the Heineken Cup in Europe — the only difference being that their numbers appear to be on the rise. Perhaps we need to see what they are doing for some tips. They also had a rise between 2008 and 2009. Since the northern hemisphere season runs over the end of the calendar year, the figures that I have used for 2009 are for the season that ended during that year. Make sense? I’m thinking that perhaps this has meant that the effect of the financial crisis was delayed to the following season in Europe.
Are we in as dire straits as we think? Maybe not, but this does not mean that the rugby community in Australia should be resting on their laurels. Overall we are holding our own when compared to the other conferences and competitions. However, the downward trend needs to be reversed — or we are going to have some problems with the financial viability of some of the clubs in the future.
So, just to reiterate: in 2012 the Reds lead the Australian conference on average attendance, capacity used, oh, and of course they won the Australian Conference. Sorry, just thought I had better take the opportunity to point that out. (You didn’t think I would miss that, did you?)
Thanks to Greg Peters, SANZAR CEO, for supplying some of the figures that I have used in this analysis.


