Our mate RuckinGoodStats has provided us with an indepth look at the two teams going into Sunday’s mega Quarter Final. You can download it by clicking on Tale of the tape RSAvAUS QF RWC2011
Now obviously a lot of the stats so far have come from games against ‘minnow’ sides so not all will be representative of the game we would expect to see these two sides be able to take to each other. Nevertheless, there are some interesting ones. Here are the headlines that RGS and I take away from the numbers… what about you?
Pace of the game – the number of minutes the ball is in play gives you an idea as to the pace of the game. Unsurprisingly, the Wallabies have been at their best with fast games, beating both RSA and NZ in the Tri Nations in games with a lot of ball in play time. The games they’ve done less well in this year have usually had relatively slow game times, the Irish game being the worst by some margin.
| Opponent | SAM | RSA | NZ | RSA | NZ | ITA | IRE |
| First Half | 16.6 | 17.5 | 20 | 15.9 | 19.8 | 16.3 | 13.8 |
| Second Half | 18.1 | 17.4 | 16.2 | 16.4 | 19.7 | 17.8 | 16.1 |
| Total | 34.7 | 34.9 | 36.2 | 32.3 | 39.5 | 34.1 | 29.9 |
Interestingly the South Africans lead the whole comp for amount of ball in play at this World Cup, while the Wallabies dwell near the bottom due to their Ireland match particularly. It will be interesting to see how this turns out on Sunday, where you would expect the Springboks to use the conditions to structure and slow the game, a tactic the Wallabies find difficult to contend with.
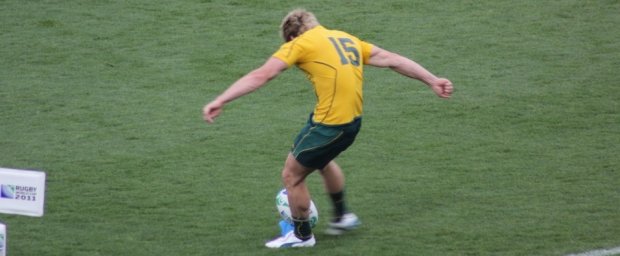
Points and kicking – bar James O’Connor’s stunning performance against Russia, the Wallabies’ kicking for the poles has been pretty woeful. Bieber’s performance has got them surprisingly to 4th in the comp for Conversions success, whereas the Saffas are at 2nd. Penalty attempts have been woeful however, and Australia languishes at 15th for successful penalty attempts. South Africa is a little better at 10th.
Here are a few of the individual success rates from RGS.
AUS kickers. In RWC: O’Connor 78% (14 from 18) Cooper 50% (4/8) Barnes 80% (4/5) Beale 0/1. In 2011: O’Connor 71% (77 from 109) Cooper 67% (84/126) Barnes 53% (9/17) Beale 71% (59/83).
RSA kickers. In RWC M Steyn 83% (19 from 23), Pienaar 100% (6/6). In 2011 M Steyn 80% (106/132), F Steyn 2/4, Lambie 77% (71/92)
Drop kicks, if it comes down to that: in 2011 M. Steyn 42% (5/12), Cooper 57% (4/7), Barnes 0/2 Genia 0/2. They are the only one who have had a crack this year.
Attack – Both teams put the same number of phases together before kicking it away or losing it: Aus 3.1 RSA 3.0 — this is 10th and 12th ranked in RWC. The difference though comes with kicking. Australia make the fewest kick errors in the comp, 0.5 per game, whereas RSA are 12th lowest with 1.3. With their lineout, it’s not surprising that the Saffas kick for touch the 4th most in the comp with 10.5 per game, whereas Australia are 17th in the comp with 7.8, indicating that they aim to keep the ball in play and speed of the game up.
Defence – Here the teams are chalk and cheese. Australia is the second best in the whole comp, having missed just 9 tackles altogether so far (1 in 9.7 attempts). South Africa on the other hand have missed 29, or 1 in 4.5 attempts, which is consistent with their 2011 average of 1 in 4.2 attempts. It also puts them at second worst in the whole RWC. They say defence wins World Cups; what do these stats tell us?
Errors – In giving away turnovers overall (errors and rucks) the Wallabies are 5th best in the comp, the Saffas are 13th. This is partly because Wallabies have the lowest ruck turnover in the comp (i.e. AUS took it into a ruck and lost it) at 1.5 per game. This is lower than their 2011 average at 2.4. RSA are ranked 9th for ruck turnovers at 3.25 per game, consistent with 2011 average.
One big stat here is that the Springboks give away the fewest number of penalties per game of any team in the RWC, at 8 per match (although this might be academic because Australia can’t kick them anyway). The Wallabies come 8th with 10.25.
Set pieces – are a little tough to judge at the RWC so far due to the calibre of the competition. However, both teams are 3rd equal highest for lineout throws not being straight, a habit Australia have picked up only in RWC. RSA favour throws to the middle and back in their lineouts, AUS favour middle and front. RSA are 2nd in the comp with quick throws.
Which numbers do you think are key for Sunday?


