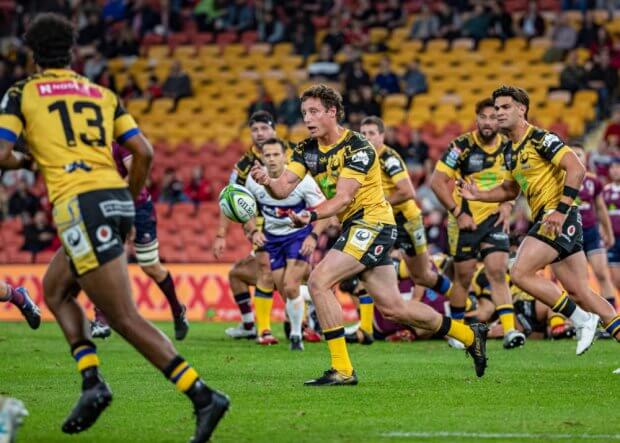
As expected, the flow and quality of Super Rugby AU picked up remarkably in week 3 as was the case in the New Zealand Aotearoa competition. Week 3 also provides us with enough data to properly compare the two competitions and spot the areas where Australia are still lacking a bit.
To do so I want to focus on two metrics this week:
The Exit rate
We slice the field into 4 zones, and then study where you start and end each play. For example Australia during the 2019 World Cup had the best exit rate of all Tier 1 nations from their own 22, but the worst exit rate from their opponent’s 50. This is a vital statistic, because the ability to exit your opponent’s 50 and drive into their 22, is a key metric of successful attacking teams.
So let us now compare how well our sides exit compared to the Kiwi sides:
The good news is that our teams exit better from our own 22, and exit (score) more when in our opponent 22. The trouble is that like Chieka’s squad, our Super teams also struggle to exit the opponent 50m zone, which in turn means we do not get enough opportunities in our opponent’s 22, which nullifies our superior ability to score once there. On average, Kiwi sides start 11.3 attacks in their opponent 22, while we start only 7.5.
How do we fix this? What would you say are the key stumbling blocks to our poor exit rate from this specific zone? One hint is that Kiwi sides kick 33.5% of times they attack here, while we kick only 27.5%? The kiwis score 1.5 tries from this zone per game on average, while we muster only 0.6 tries per team per game.
Opportunities to points %
During the world cup, the 6 top teams going into the quarter final all converted more than 10% of their attack opportunities to points. 10% is therefore an important benchmark. Note however that for the purpose of these comparisons, we use the data from both the winning and losing team to study how efficient teams are with their possession.
Once more we will split the field into 4 zones to understand where the sides are more efficient:
Australian teams tend to score more regularly from our own 50, yet once more we see an impotence in the Blue (opponent 50) zone. From the data so far I infer that Australian sides either defend a lot more vigorously once their opponent reaches this zone, OR that our attack play in this zone has an introverted personality.
Cast your eye to this table to understand what I mean:
The Kiwi’s do chuck the ball about more and play at a faster pace, and this is nowhere more prevalent than in the opponent 50, where they handle the ball more than double the amount of Ozzie sides, and break the opponent line twice as many times.
I think our teams are still too shy to play rugby in our opponent 50m zone, because we fear failure. However this introverted personality is not yielding the correct outcomes. It is time to grow a pair and start attacking with more gusto when we make it into this zone. We currently carry up 41.7% of all ball in this region, while the Kiwis carry only 35% and pass/kick the rest.
In other words we become direct and predictable, whereas the Kiwis tend to spread it.
Think I am telling porkies? Then chew on these numbers:
Each time you manage to string together 3 passes in a row, you essentially beat the line-speed of the defence, not to mention that you shifted the point of collision to a wider channel. Also each time you shift play all the way to the tramline, you ask some heavy forwards to shift their frames a bit more and in the process create gaps up the middle.
To achieve the above, you HAVE to be comfortable passing the ball and not fear making mistakes. That for me is a key part of our game we need to improve upon, and I will be tracking these numbers throughout the tournaments to see if our teams catch up!


