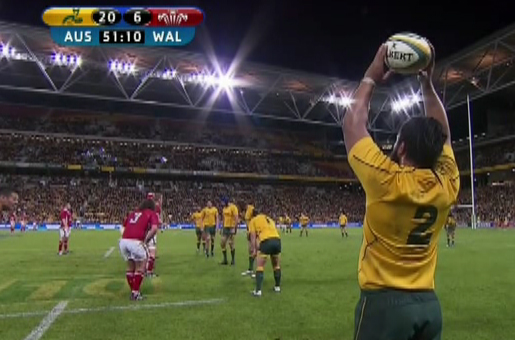
This video takes a further look at TPN’s lineout throwing
[youtube id=”8clP_u1Idw0″ width=”600″ height=”350″]
Of course, with hindsight it’s easy to say that Moore should have been starting over TPN in the first Test and then use the results of the three Tests to justify that proposition. Was there anything that the selectors should have taken into account before selecting the first Test team?
I don’t think there’d be many people who’d argue that TPN’s lineout throwing has been the equal of Moore’s in past seasons but there seems to be a view that TPN has improved in 2012. Let’s look at the Super Rugby data for both players up to the mid-season break. I haven’t reviewed every lineout so I’ll just have to give you the data on lineouts won and throws called ‘not straight’, rather than an analysis on the quality of their throwing.
| Tatafu Polota-Nau | Stephen Moore | |||
| Total | Average Per Match | Total | Average Per Match | |
| Minutes Played | 774 | 64.5 | 987 | 75.92 |
| Lineouts Thrown | 95 | 7.92 | 130 | 10 |
| Lineouts Won % | 87% | 87% | ||
| Lineout Throws Not Straight | 7% | 5% | ||
| Runs | 56 | 4.67 | 108 | 8.31 |
| Metres Made | 346 | 28.83 | 451 | 34.69 |
| Average Metres Made Per Run | 6.18 | 4.18 | ||
| Ruck & Maul Involvements | 43 | 3.58 | 107 | 8.23 |
| Tackles Made | 105 | 8.75 | 130 | 10 |
| Involvements | 204 | 17 | 345 | 26.54 |
| Involvments / Mins | 0.264 | 0.35 | ||
| Tackles Missed | 12 | 1 | 15 | 1.15 |
| Tackle Accuracy % | 90% | 90% |
There’s nothing in that data that says there’s much between the two, which suggests TPN’s lineout throwing has improved over past seasons. The ‘not straight’ numbers says TPN’s throw won’t be straight once in every 14 lineouts, while Moore’s will be crooked once in 19.
Another thing I would have looked at was how TPN had performed in lineouts in the two matches before the break, after he’d come back from a two-game layoff for the Waratahs. In those two games the percentage of lineouts won by the Waratahs with TPN throwing was only 75.00%. In the corresponding two Brumbies matches the percentage of lineouts won on Moore’s throw was 89.66% — which suggests that Moore was in the better lineout form going in to the June Tests.
Given that Moore started in the Scotland Test there may have been a plan to start TPN in the first Test against Wales, and then make a decision on who was the better starter.
The Wallabies won 100% of their lineouts in the Test against Scotland with Moore throwing in dreadful conditions. I watched TPN throwing in training before the first Test against Wales and his performance in training was not as good as it was in the game itself, where I rated his good throws at only 50% — so there’s no question for me: Moore should have started in the second Wales Test at the latest.
I may sound like a broken record but Robbie Deans’s selections once again leave me baffled.
We are a fan run website, we appreciate your support.
💬 Have you got a news article suggestion? Submit a story and have your say
👀 Follow us on Facebook, Instagram and X.com
🎵 Listen to our Podcasts on Spotify and iTunes
🎥 Watch our Podcasts on YouTube


