

The following article has been written by Eloise Pasteur. Eloise is a former, bad player of rugby while at school (a long time ago) who watches avidly and has a day job teaching science, maths and stats to people of all levels of ability. Occasionally she lets her love of rugby and her love of stats collide.
This article is going to look at the attack stats of the Super Rugby season just past.
If you’ve read my previous article about defence stats, then the following paragraphs aren’t of much use to you. You can just skip to first heading below.
I’ve used simple correlations to try and analyse what stats tell us interesting thing about what is going on. Remember that correlation does NOT imply causation. For each statistic, the blue graph is the whole competition, the gold graph is just the Australian conference, the black is just the New Zealand conference and the green just the two South African conferences combined.
So, let’s attack these attack stats!
More Metres Means More On The Meter
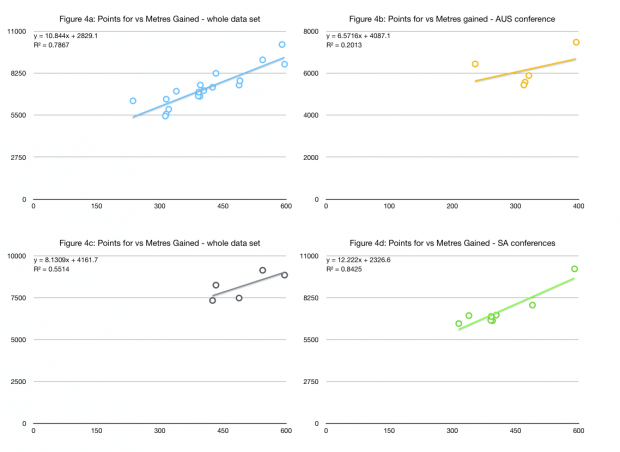 Overall there is a pretty strong correlation between points for and metres gained.
Plotting the data this way round makes it hard to talk about what’s going on in terms that are easy to talk about. Reversing the data and plotting that gives the following interpretation: for every 100 metres gained an Australian side typically scores 3 points, and the sides from the other two conferences score 6 points.
NOTE – this is not causation. You can’t say “we made 500 metres so we should have 15 points” but metres gained over a season is probably a not terrible estimate of overall offensive activity. In a particular game you might score a lot of points off short-metre gains from turnovers on their try line and interceptions in their half and a strong defensive effort, but over the season this is a decent measure of your overall offensive effort.

The Kiwis and the SA sides are at least twice as efficient at converting this measure of offensive effort into points as the Australians. This is one to keep an eye on over The Rugby Championship, where there will be 6 games. Just divide the points scored by the total metres gained and see how the various sides are doing.
Saying “metres gained is a decent indicator of offensive activity” is true but some types of defence need to be considered. Not all defensive systems are as aggressive as the British & Irish Lions was this July, with some willing to give up metres but not points such as the ‘bend, not break’ system. And then, of course, every team’s defence tightens up close to their tryline.
Why are Australian sides so lacklustre in attack? OK, they played five games against the Kiwis and came up against what the eyeballs would suggest are five of the top few defences in the competition which doesn’t help. But they also played each other twice, and so played four or six games against some of the worst defences in the competition too. It ought to balance out somewhat! It looks like something really needs to be done here.
Just Beat It (Defenders, That Is)
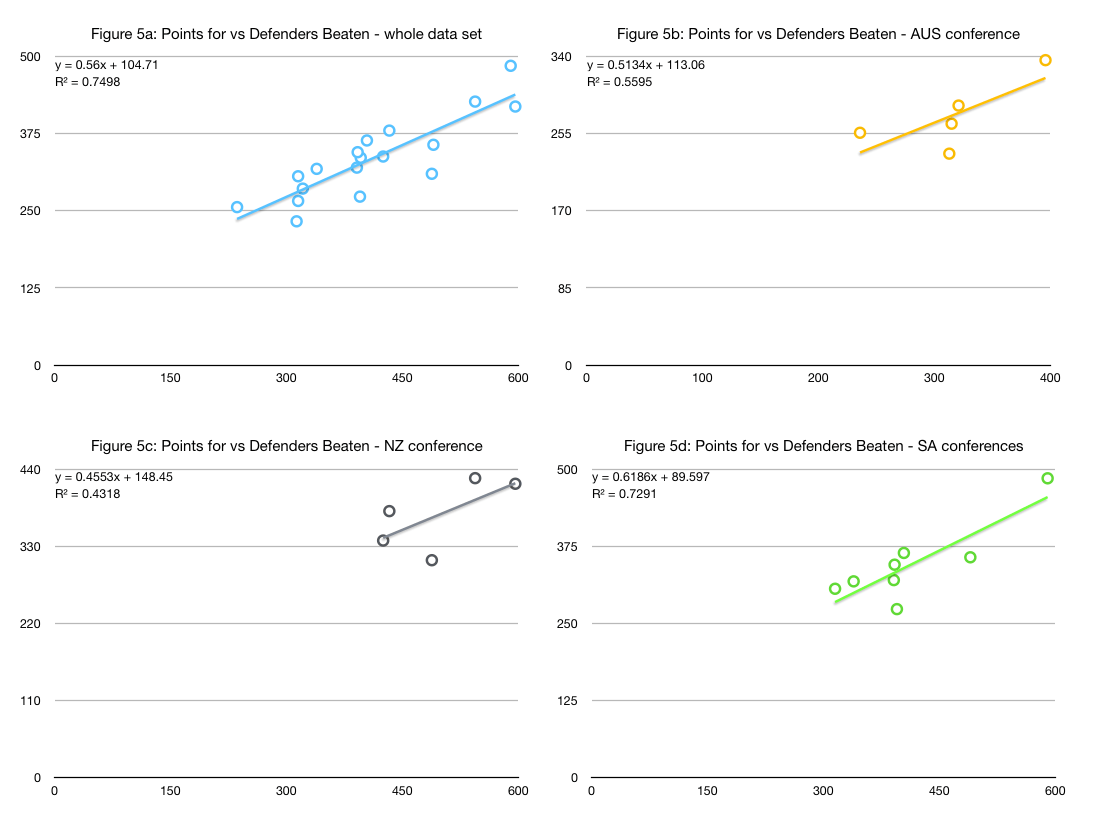
Finally a nice, non-contentious one. Beating defenders better seems to lead to scoring points. The Kiwis do it best, the South African conferences do it the worst, the Aussies are pretty much on the mean.
Calculating the numbers the simpler way round, you score 1.3 points per defender beaten, or, roughly, you score a converted try per five defenders beaten.
This might seem low but, again, bear in mind that although we remember the spectacular tries from deep, if you beat a defender inside your own 22 it often doesn’t lead to points, whereas beating a defender in their 22 is much more likely to lead to a score. Also, beating a defender won’t always lead to a try, points can be scored after you beat a defender and they’re offside at the next ruck or something and you kick the penalty. These statistics are only really a superficial look at what’s going on.
It’s hard to say much more than that. I don’t think you can coach “beat the defenders” nor “don’t get beaten” really but these seem like important things on attack and defence respectively. But this isn’t a new lesson.
It is worth remembering that low rate of converting defenders beaten into actual tries though.
Now for one that really surprised me.
Offloads Don’t Help
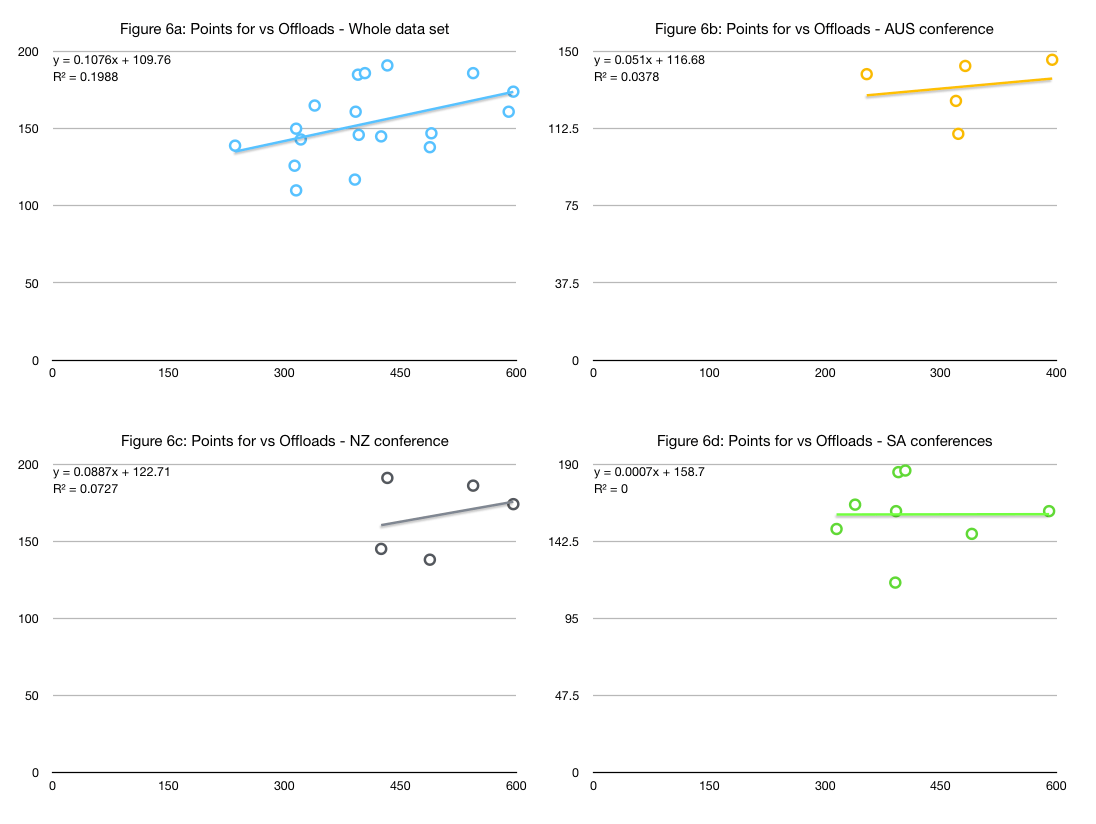
There is no good correlation between offloads and scoring points. For the SA conference there’s absolutely no effect, that line is as flat as a pancake.
I don’t know if this because the data just collects “that was an offload” and doesn’t record what happens – success, failure, knock-on, interception etc. or what. The eyeball test suggests successful offloads have a big impact, but a knock-on gives up possession and an interception might well give up 5 or 7 points to the opposition. The Kiwis apparently do it better, but it’s hard to be sure with the small data set so we can’t really trust that.
This is information that really needs to be cleaned up to be of use to the casual fan. Successful offloads (going to a team-mate that catches the ball and is tackled quickly and maintains possession, or runs, kicks or passes the ball) would be a good starting point. Proportion of successful offloads would also be good.
Kicking – What Is It Good For?
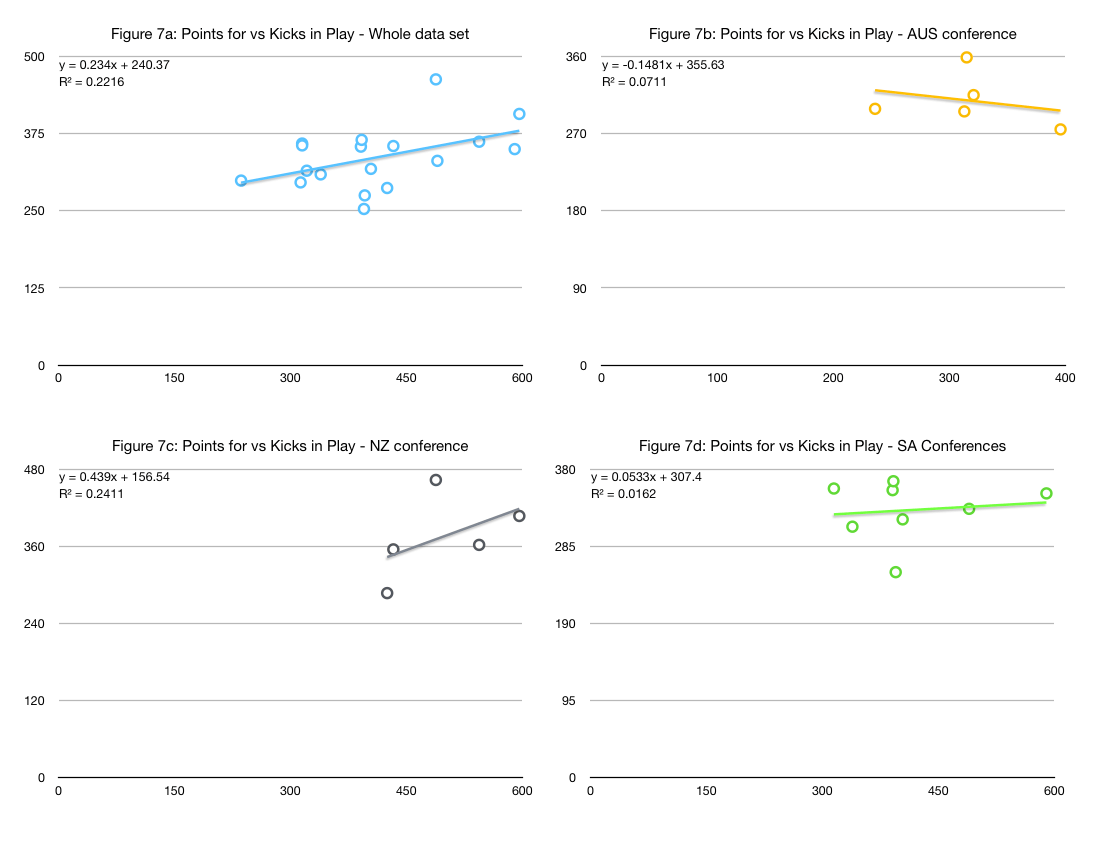
Finally kicks in play. There is nothing we can be very sure about here and the comments I’m about to make are rather tentative because of that.
It appears that there’s not much correlation between kicks in play and points scored that we can trust but any there is is slightly positive – if you kick more, you score slightly more points, maybe. Thinking about it, that shouldn’t be a surprise, quite a lot of kicks in play are to relieve pressure, when you’re in your 22 for example, and you give up possession so you don’t expect to score points.
Those slopes aren’t really exaggerated, so it’s noticeable to the naked eye that the SA conference is pretty much flat… kicks in play don’t relate much to scoring points. For the NZ conference there’s a fairly strong up slope – kicks in play do relate to scoring points. For the Australian conference there is a weak slope – that suggests kicks in play seem to COST your team the chance of scoring points.

Applying the eyeball test Beauden Barrett, Lima Sopoaga, Aaron Cruden and, to a lesser extent, Richie Moanga all kick for some of their players in an attacking way (I haven’t seen enough Blues games but I wouldn’t be surprised if it happened for them too). It’s not 100% successful but it is certainly a dangerous part of their attacking arsenal. Defensive kicks are too from most of their players and various full backs. But how often do you see a New Zealand player make an aimless kick? It does happen, as do poor kicks and kicks out on the full, but it’s a scatter of them for each player across the season.
The impression is that, although there are these attacking kicks from Australian 10’s there are a lot of poorer kicks, kicks to players, kicks out on the full, kicks that invite counterattacks and the like. This stat would tend, maybe, to support that impression.
Conclusion
What could the Wallabies, and the Super Rugby teams, learn? Or what can we, the fans learn and try to look out for?
Australian teams don’t very good job of gaining meters (although that could be down to good Kiwi defences), nor do they do a good job of kicking the ball. As we all know, we’ve seen the Kiwis make mistakes with the boot, but the fact is that they don’t make many. But those Kiwis make more kicks, and also don’t just let their flyhalves kick – their wingers kick too! How often do we see the Wallabies make bad kicks?
I briefly played with the data from the 8 sides in the finals against the rest – what seem to be the characteristics of the successful sides compared to the unsuccessful ones seems like a reasonable learning point.
There are some common things that come through: their metres gained is a better indicator of points scored (and they’re more efficient in the points per metre stat). However, given there are 4 Kiwi sides and 3 South African sides but only one Australian side, while ‘the others’ are nearly half Australian, how much does this just reflect the fact that this split could be down to the national styles of play rather than the successful teams? The better linking between tackle efficiency and points against is not there in the data – that seems to be emphasised more here, but the NZ and SA are more efficient at the metres gained and scoring points linkage and dominate that best eight and probably pull the graphs that way.
The clubs and international coaches have far more data and there is far more analysis that can be done. But it seems some of the data we’re shown in official statistics is also a poor summary of the match so it’s worth being wary what we look at and consider important.
You can find Eloise’s previous article over here.