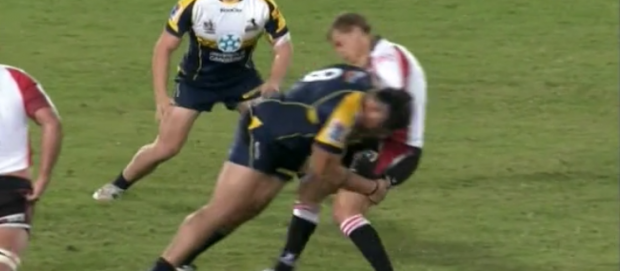
 They say defence wins world cups, or test matches, or tournaments, or something like that. Anyway – defence is important.
So how are the Super teams doing?
Well, the tackle completion stats don’t really tell us too much with 13 teams being within 3% of each other – except that is for the Stormers, who really are that boring solid.
So it would seem we need to delve a little deeper. Obviously one of the key next questions will be where do they miss those tackles?
Take the Crusaders for example, who surprisingly are sitting second last on the completion percentage table. Here’s their ranking for tackles missed in the various zones of the field:
Crusaders tackles missed:
| Oppo’s 22 | 2nd highest missed |
| Between half way and oppo’s 22 | Highest missed |
| Between half way and own 22 | 4th highest missed |
| In own 22 | 3rd lowest missed |
Looks like the ‘Saders will only let you run so far.
 Another interesting quirk of the table is with the Highlanders. They also seem to be not so hot on the tackle completion percentage, until you realise that because of the ridiculously large amounts of possession they hold onto, the tackle percentage they miss is worth 1 fifth of bugger-all.
In actual numbers they yield the second lowest misses of all teams in their 22 and give up the fewest clean line breaks. This results in them giving away only 1.6 tries per match – the 3rd lowest in the comp.
Conversely, you look at the Rebels, who have a better completion rate than the Clan, but yield more than twice as many tries. They’re 11th for tackles missed between the halfway and their 22, but then miss the most tackles of all teams in their own 22.
This may be partly because (on average until now) their opposition sees a lot of the ball at the wrong end of the field for the Rebels, but they also yield the second highest number of clean line-breaks and offloads in the comp. This to me says those tackles they’re “completing” are not dominant enough (for the offload to be made), and that there might well be defensive organisational issues on top of that to yield the line-breaks. These things together result in their shocking yield of 3.5 tries per match.
Which brings us to what I think is a more interesting chart above right, for which I have no name because basically its just a few KPIs I threw together. The ‘doh’ part of it is that the top seven teams on the Super ladder are also the seven stingiest when it comes to giving away tries. Go figure, but whatever your overall defensive strategy, that’s the bottom line.

In looking at this chart though, the Reds stick out a mile for the offloads they yield, averaging over 8 conceded per match, where most teams are grouped around 5 or 6.
Could this be due to the “chop ’em low” strategy the Reds have been engaging to set up their pilfering genius Liam Gill? Perhaps this allows some teams to get the ball free, seen spectacularly when the Chiefs managed 20 in their one game against the Reds (the Chiefs average the most in the comp at 9.5 per match).
And who managed the second highest number of offloads against the Reds so far this season? The Brumbies with 14. What might we see this weekend you wonder?
With thanks to Rucking Good Stats for the data


