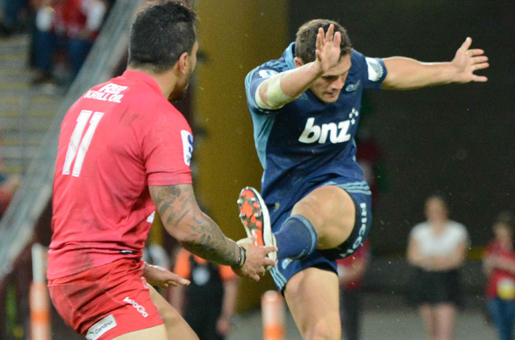
 It won’t surprise you to know that the South African teams and the Brumbies coached by a South African kick the ball more than other teams in the competition.
The decision on how much to kick (and the successful execution of those kicks) plays a big part in game plans and the variance in the kicking game of teams shows the differences in approach to the game.
This chart shows the percentage of possession where each team kicks the ball after 12 rounds of the competition and confirms just how little the Waratahs have been kicking.


